As any engineer can tell you, sensitivity and stress testing are important tools in determining how a system can fail and therefore, determining the safe usage for that system. When it comes to your financial life, it should be no different. Stress testing your financial plan is an important exercise in determining the health of your wealth. While this a natural inclination for engineers, it can be unclear where to start. Let’s look at the key variables and the impact they have on a financial plan.
The Key Variables
A good financial plan will have numerous inputs (correct treatment of various accounts, a detailed cash flow, proper modeling for taxes, etc.) but the primary factors can be boiled down to four categories: 1) spending, 2) inflation, 3) life expectancy, and 4) returns.
Spending
Here we look at spending rate (annual spending divided by portfolio size), and we will see, it’s one of the largest levers in a financial plan—and the one most in our control.
Inflation
Most retirees will need to increase their spending over time to keep pace with inflation. Higher inflation, and therefore, higher spending can strain a financial plan.
Life Expectancy
While we don’t know with certainty how many years we have left, we can make reasonable estimates based on actuarial tables, family history or personal health. Clearly outliving the averages is great personally, but can put stress on a financial plan.
Portfolio Returns
The realized returns for a portfolio and the level or risk taken obviously affect a financial plan as well. Some of this is out of your control (we can’t control the level or timing of market returns), but there are a few levers to pull such as minimizing risk and building a diversified portfolio to smooth out returns and capture factors of higher returns.
Now that we’ve outlined the key factors let’s look at their sensitivity to change.
Key Variables: Sensitivity to Change
Using the free tools available at portfoliovisualizer.com we can create some basic scenarios to see how these key variables are impacted.
Using a Monte Carlo simulation to perform the analysis, we’ll start with a baseline model using the following inputs:
- $1 million in assets
- 5% annual spending adjusted annually for inflation
- 30-year life expectancy
- A 60% stock / 40% bond portfolio (long-term, average historical return of 8.4% with an 11% standard deviation)
- Long-term average inflation (2.9% annually with a 1.9% standard deviation)

So, what happens when we tweak the key variables? Let’s do some sensitivity testing.
Spending
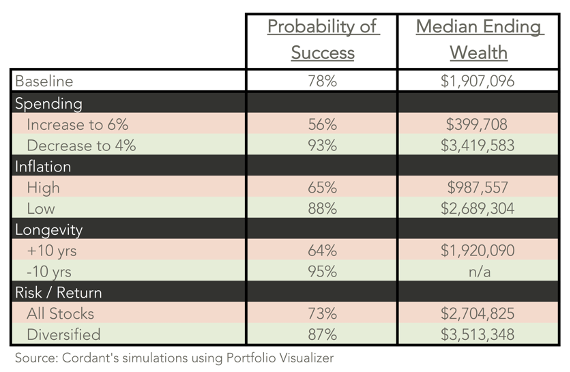
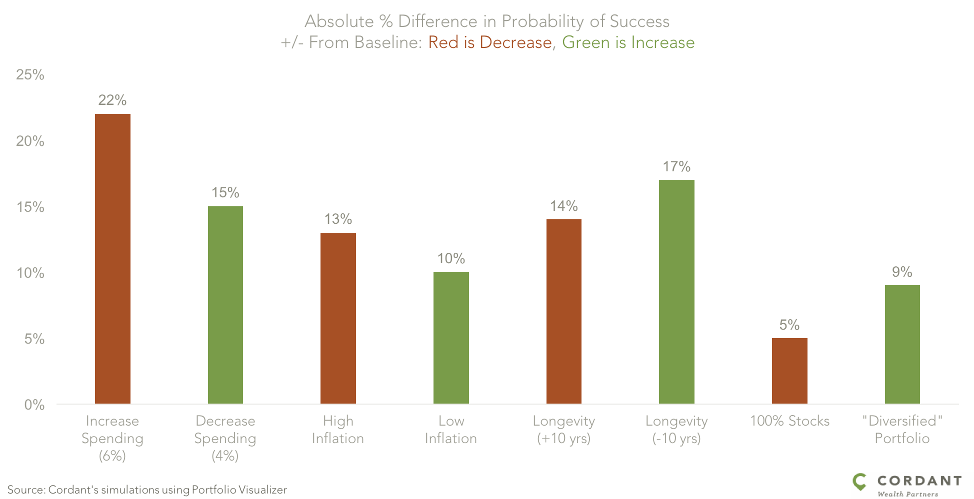
Increasing spending by 20% to 6% annual withdrawals lowers our odds of success a massive 22 percentage points from 78% to 56%. Of the scenarios run, this is the largest single adverse impact on the plan. On the other hand, reducing spending by 20%—from 5% to 4%—increases the odds of success by 15 percentage points to over 90% and increases median ending wealth by over $1.5 million.
Inflation
Here we model a “high” inflation scenario where we increase inflation by 1% from the longer-term average and see our odds of success fall by 13 percentage points. Additionally, our “high” inflation scenario decreases ending median wealth by nearly $1 million as spending must be increased annually to keep pace with this higher inflation. On the flip side, a one percentage point decrease in inflation increases odds of plan success to 88%.
Longevity
After spending, changes in longevity have the largest impact on plan success. Increasing (decreasing) life expectancy by a decade decreases (increases) plan probability of success by 14% and 17% respectively. Median wealth after 30 years doesn’t materially differ from our baseline model.
Risk / Return
And finally, the risk and return realized in a portfolio. Here we run two scenarios. The first assumes an all-stock portfolio which pushes average returns to over 10% but increases portfolio volatility to 18%. Despite the higher returns, since they come at the expense of more volatility, the plan is actually worse off—odds of success are lowered by five percentage points. However, median ending wealth is higher than the baseline scenario as this portfolio comes with more upside—we’ve simply widened the range of expected outcomes, both good and bad.
In the second scenario, we model a “diversified” portfolio where we assume global diversification and allocations to proven factors of returns (value and size) that over time have added about 1% to returns for a similar level of risk. Moving from the 60/40 portfolio to this “diversified” portfolio raises our success probability by nine percentage points.
All in, we see in the chart above (at least based on the tweaks we’ve modeled) that spending behavior has the largest impact on a financial plan, followed by longevity, inflation, then returns.
The “Worst” Case
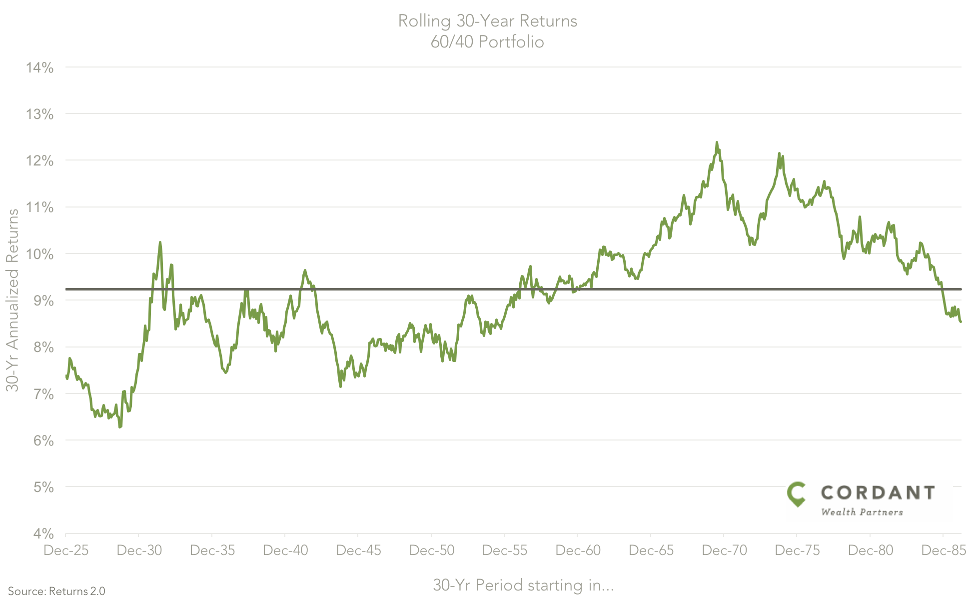
Now, so far this has been more sensitivity testing (tweaking our variables) than actual stress testing. So, let’s take a look at what happens in a “worst case” scenario—a true stress test. From 1926 to the present, the geometric average return for the full period on a 60/40 portfolio is about 8.4%. But, this has varied over rolling periods as long as thirty years. The average of all 30-years periods is 9.2% with a best case being 12.4% for someone starting 1970 and riding the tech bubble right into 2000. Conversely, the worst case is 6.3% for our unlucky retiree who hung ‘em up in 1929, right before the great depression.
So, since we’re stress testing now, let’s model this “worst case” scenario. Modeling the 6.3% return with the remaining variables reflecting the baseline assumptions leaves us with a probability of success at 47%. This scenario is clearly bad and reduces the probability of success by 31 percentage points. In the real world, adjustments would likely be made to adjust the plan and improve the odds to retirement success. However, it’s still pretty remarkable that retiring into the teeth of the great depression, using our assumptions, leaves us with basically a coin flip chance at success. Now, concerning adjustments, as we saw before, spending has a large impact on the plan. So what if we keep the “great depression” returns but reduce spending to 4%? Now our plan’s probability of success rebounds to 72%.
What can you do with this information?
Now that you understand the key variables in a financial plan, what can you do? I’d suggest the following:
- Get your financial plan in place: Pretty obvious, but until you have a baseline financial plan in place, you will not be able to model different scenarios and determine their effects on your financial future.
- Focus on what you can control: We saw that spending has a large impact on the success of a financial plan, but that inflation, longevity and how you invest are also important. It’s important to have a plan in place to deal with and mitigate these risk factors as well.
- We can help: And finally, if you’d like some help getting your financial life in order and planning for the key variables that will impact your success, get in touch. We’d be happy to talk about your individual situation in detail.
For clients, we are running a much more in-depth planning analysis considering individual parameters, using detailed cash flows, etc.
Click here for disclosures regarding information contained in blog postings.


